IoT Platform with Databricks Intelligence Data Platform - Ingesting Industrial Sensor Data for Real-Time Analysis

What is The Databricks Intelligence Data Platform for IoT & Manufacturing?
It's the only enterprise data platform that allows you to leverage all your data, from any source, running any workload to optimize your production lines with real time data at the lowest cost.
The Lakehouse allow you to centralize all your data, from IoT realtime streams to inventory and sales data, providing operational speed and efficiency at a scale never before possible.
Simple
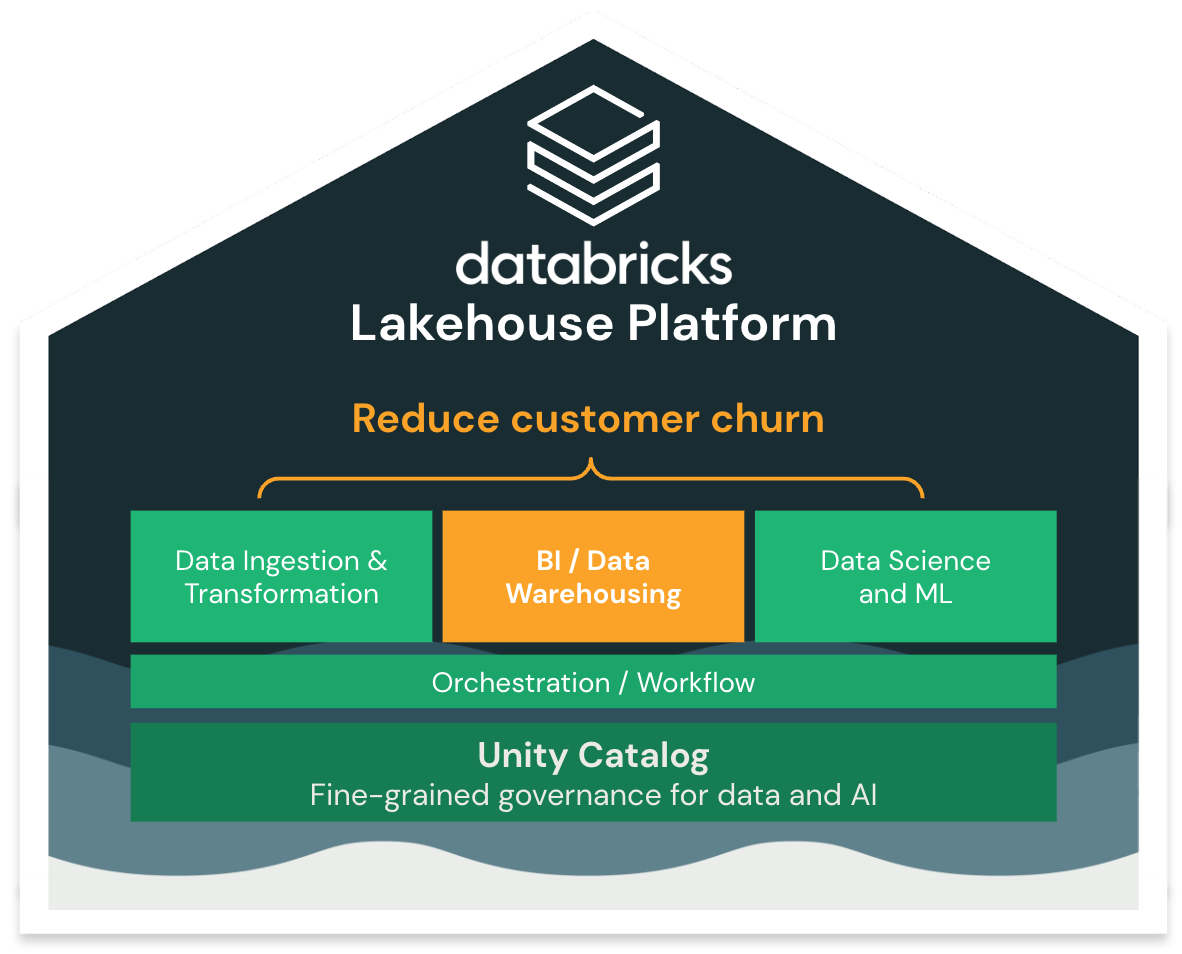
One single platform and governance/security layer for your data warehousing and AI to **accelerate innovation** and **reduce risks**. No need to stitch together multiple solutions with disparate governance and high complexity.
Open
Built on open source and open standards. You own your data and prevent vendor lock-in, with easy integration with a wide range of 3rd party software vendors and services. Being open also lets you share your data with any external organization, regardless of their make-up of their software stack or vendor.
Multi-cloud
One consistent data platform across clouds. Process your data where you need it or where it resides.

Wind Turbine Predictive Maintenance with the Databricks Intelligence Data Platform

Being able to collect and centralize industrial equipment information in real time is critical in the energy space. When a wind turbine is down, it is not generating power which leads to poor customer service and lost revenue. Data is the key to unlock critical capabilities such as energy optimization, anomaly detection, and/or predictive maintenance.
Predictive maintenance examples include:
- Predict mechanical failure in an energy pipeline
- Detect abnormal behavior in a production line
- Optimize supply chain of parts and staging for scheduled maintenance and repairs
What we'll build
In this demo, we'll build a end-to-end IoT platform, collecting data from multiple sources in real time.
Based on this information, we will show how analyst can proactively identify and schedule repairs for Wind turbines prior to failure, in order to increase energy production.
In addition, the business requested a dashboard that would allow their Turbine Maintenance group to monitor the turbines and identify any that are currently inoperable and those that are at risk of failure. This will also allow us to track our ROI and ensure we reach our productivity goals over the year.
At a very high level, this is the flow we will implement:

1. Ingest and create our IoT database and tables which are easily queriable via SQL
2. Secure data and grant read access to the Data Analyst and Data Science teams.
3. Run BI queries to analyze existing failures
4. Build ML model to monitor our wind turbine farm & trigger predictive maintenance operations
Being able to predict which wind turbine will potentially fail is only the first step to increase our wind turbine farm efficiency. Once we're able to build a model predicting potential maintenance, we can dynamically adapt our spare part stock and even automatically dispatch maintenance team with the proper equipment.
Our dataset
To simplify this demo, we'll consider that an external system is periodically sending data into our blob storage (S3/ADLS/GCS):
- Turbine data *(location, model, identifier etc)*
- Wind turbine sensors, every sec *(energy produced, vibration, typically in streaming)*
- Turbine status over time, labelled by our analyst team *(historical data to train on model on)*
*Note that at a technical level, our data could come from any source. Databricks can ingest data from any system (SalesForce, Fivetran, queuing message like kafka, blob storage, SQL & NoSQL databases...).*
Let's see how this data can be used within the Lakehouse to analyze sensor data & trigger predictive maintenance.
1/ Ingesting and Preparing the Data (Data Engineering)

Our first step is to ingest and clean the raw data we received so that our Data Analyst team can start running analysis on top of it.
Delta Lake
All the tables we'll create in the Lakehouse will be stored as Delta Lake tables. [Delta Lake](https://delta.io) is an open storage framework for reliability and performance.
It provides many functionalities such as *(ACID Transaction, DELETE/UPDATE/MERGE, Clone zero copy, Change data Capture...)*
For more details on Delta Lake, run `dbdemos.install('delta-lake')`
Simplify ingestion with Delta Live Tables (DLT)
Databricks simplifies data ingestion and transformation with Delta Live Tables by allowing SQL users to create advanced pipelines via batch or streaming. Databricks also simplifies pipeline deployment, testing, and tracking data quality which reduces operational complexity, so that you can focus on the needs of the business.
Open the Wind Turbine
Delta Live Table pipeline or the [SQL notebook]($./01-Data-ingestion/01.1-DLT-Wind-Turbine-SQL) *(Alternatives: DLT Python version Soon available - [plain Delta+Spark version]($./01-Data-ingestion/plain-spark-delta-pipeline/01.5-Delta-pipeline-spark-iot-turbine))*.
For more details on DLT: `dbdemos.install('dlt-load')` or `dbdemos.install('dlt-cdc')`
2/ Securing Data & Governance (Unity Catalog)

Now that our first tables have been created, we need to grant our Data Analyst team READ access to be able to start analyzing our turbine failure information.
Let's see how Unity Catalog provides Security & governance across our data assets and includes data lineage and audit logs.
Note that Unity Catalog integrates Delta Sharing, an open protocol to share your data with any external organization, regardless of their software or data stack. For more details: `dbdemos.install('delta-sharing-airlines')`
Open [Unity Catalog notebook]($./02-Data-governance/02-UC-data-governance-security-iot-turbine) to see how to setup ACL and explore lineage with the Data Explorer.
3/ Analysing Failures (BI / Data warehousing / SQL)

Our datasets are now properly ingested, secured, are of high quality and easily discoverable within our organization.
Data Analysts are now ready to run BI interactive queries which are low latency & high throughput. They can choose to either create a new compute cluster, use a shared cluster, or for even faster response times, use Databricks Serverless Datawarehouses which provide instant stop & start.
Let's see how Data Warehousing is done using Databricks! We will look at our built-in dashboards as Databricks provides a complete data platform from ingest to analysis but also provides to integrations with many popular BI tools such as PowerBI, Tableau and others!
Open the [Datawarehousing notebook]($./03-BI-data-warehousing/03-BI-Datawarehousing-iot-turbine) to start running your BI queries or access or directly open the Wind turbine sensor dashboard
4/ Predict Failure with Data Science & Auto-ML

Being able to run analysis on our historical data provided the team with a lot of insights to drive our business. We can now better understand the impact of downtime and see which turbines are currently down in our near real-time dashboard.
However, knowing what turbines have failed isn't enough. We now need to take it to the next level and build a predictive model to detect potential failures before they happen and increase uptime and minimize costs.
This is where the Lakehouse value comes in. Within the same platform, anyone can start building an ML model to predict the failures using traditional ML development or with our low code solution AutoML.
Let's see how to train an ML model within 1 click with the [04.1-automl-iot-turbine-predictive-maintenance]($./04-Data-Science-ML/04.1-automl-iot-turbine-predictive-maintenance)
Automate Action to Reduce Turbine Outage Based on Predictions

We now have an end-to-end data pipeline analyzing sensor data and detecting potential failures before they happen. We can now easily trigger actions to reduce outages such as:
- Schedule maintenance based on teams availability and fault gravity
- Stage parts and supplies accordingly to predictive maintenance operations, while keeping a low stock on hand
- Analyze past issues and component failures to improve resiliency
- Track our predictive maintenance model efficiency by measuring its efficiency and ROI
*Note: These actions are out of the scope of this demo and simply leverage the Predictive maintenance result from our ML model.*
Open the DBSQL Predictive maintenance Dashboard to have a complete view of your wind turbine farm, including potential faulty turbines and action to remedy that.
5/ Deploying and Orchestrating the Full Workflow

While our data pipeline is almost completed, we're missing one last step: orchestrating the full workflow in production.
With Databricks Lakehouse, there is no need to utilize an external orchestrator to run your job. Databricks Workflows simplifies all your jobs, with advanced alerting, monitoring, branching options etc.
Open the [workflow and orchestration notebook]($./05-Workflow-orchestration/05-Workflow-orchestration-iot-turbine) to schedule our pipeline (data ingetion, model re-training etc)
Conclusion
We demonstrated how to implement an end-to-end pipeline with the Lakehouse, using a single, unified and secured platform. We saw:
- Data Ingestion
- Data Analysis / DW / BI
- Data Science / ML
- Workflow & Orchestration
And as a result, our business analysis team was able to build a system to not only understand failures better but also forecast future failures and take action accordingly.
*This was only an introduction to the Databricks Platform. For more details, contact your account team and explore more demos with `dbdemos.list()`!*